How to Vibe Code a Call QA Dashboard in an Afternoon
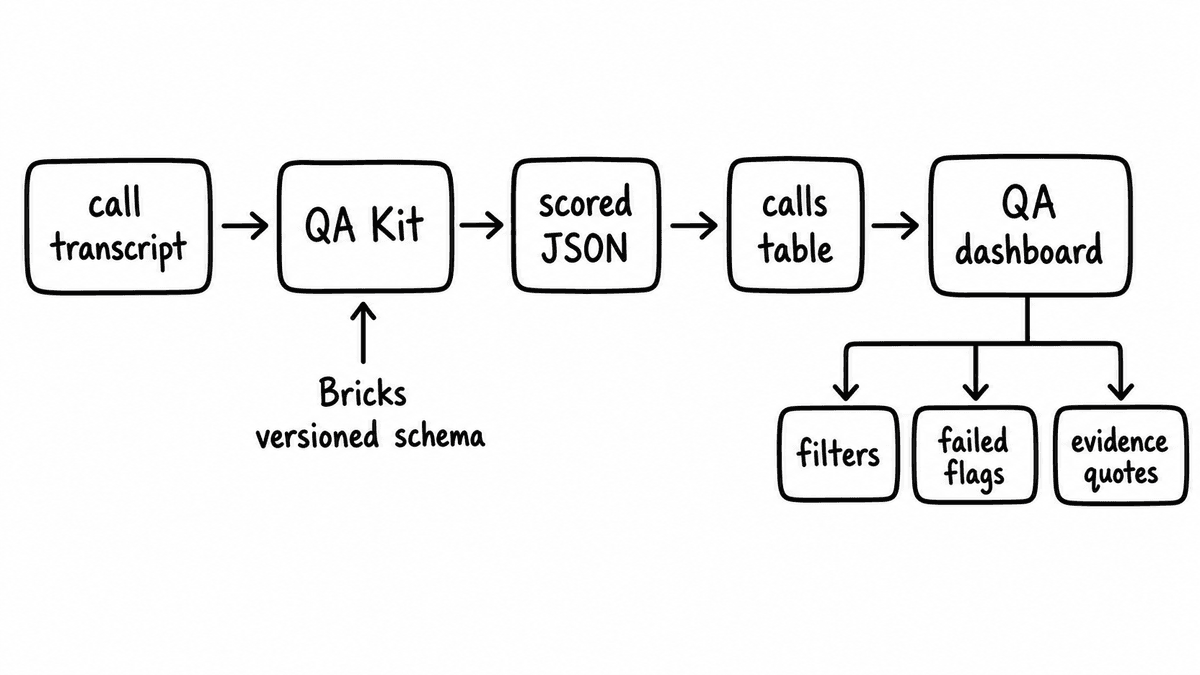
A QA lead opens Monday with two hundred calls from last week and time to listen to maybe eight of them. By Wednesday the sample is closed, a number gets reported, and nobody can point to the moment in a transcript that justified it. A call QA dashboard fixes the second half of that problem: it takes scored call data that already exists as structured JSON and turns it into something a reviewer can filter, sort, and audit without reopening recordings. You can build one in an afternoon, because the hard part, turning the conversation into typed fields, has already happened upstream.
This guide describes that build. It starts from the operational pain, shows the shape of the scored JSON your dashboard renders, names the fields you read, and explains where the Semarize API sits in the flow. There is no full code listing here, by design. The point is the workflow and the data contract, not a specific framework.
Why manual QA review does not scale
Manual QA fails in two predictable ways. The first is coverage: a reviewer who listens to calls one at a time can only cover a small fraction of volume, so most teams sample five to ten percent and hope it is representative. It rarely is, because the calls that most need review are the ones nobody flagged. The second failure is auditability. When the score comes from a person listening and ticking boxes, the result is an opinion with no attached evidence, and a rep who disputes a fail has no transcript line to argue with. Two reviewers grading the same call to the same rubric routinely disagree, and there is no record of why.
Automated scoring solves coverage and consistency, but it produces a new artefact that most teams then struggle to use: a stream of scored JSON, one object per call, sitting in a webhook log or a database table. That data is correct and complete, and it answers every question a QA lead has, but it answers them in a form no QA lead wants to read. A call QA dashboard is the view layer that closes that gap. It does not score anything itself; it renders what the scoring step already decided, with the evidence attached.
The shape of the scored JSON your dashboard renders
Everything the dashboard does depends on the structure of the data it reads, so start there. A Kit is a versioned schema that groups related evaluation criteria, and running it against one conversation returns the same shaped JSON object every time, with one typed field per Brick. A Brick asks one specific, evidence-answerable question and returns one concrete typed value: a boolean, a score on a defined scale, an extracted string, or a categorical flag. Because the schema is versioned, the field names and types you build the dashboard against do not change silently under you.
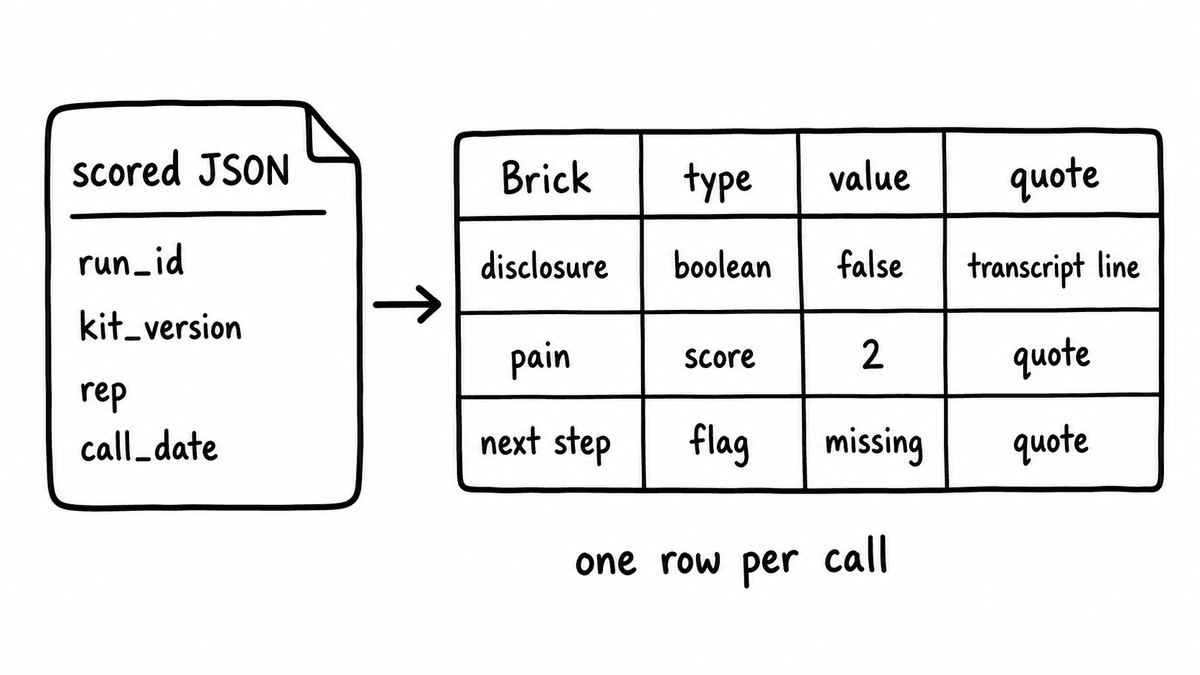
For a single call the object carries identity, a run_id and kit_version, plus the call context you need for filtering: rep, call_date, call_type, and an account or deal reference. Then each Brick contributes a field. A compliance check returns "disclosure_given": false. A discovery-quality check returns "pain_quantified": 2 on a defined scale. Where the Brick is configured to return evidence, the same field carries the transcript quote that produced the value and, for grounded checks, a reference to the document rule it tested against. The dashboard reads false as a failed-check flag, reads the score as a column value, and reads the quote as the audit trail.
Where Semarize sits in the flow
Semarize is the intelligence layer in the middle, and nothing else in your stack changes shape around it. A call ends on whatever platform your team already uses, and the transcript comes from Gong, Fathom, Zoom, Teams, Meet, or an upload, because Semarize is transcript-agnostic and processes after the call. You send that transcript to a Run of your QA Kit, and the API returns the typed JSON described above by webhook, by incremental polling, or as part of a historical backfill if you are scoring calls that already happened.
Semarize is supplemental here, not a replacement. If you already run Gong or Chorus for recording and search, they keep doing that; Semarize adds the structured-output layer they do not expose natively, so the same calls produce typed fields your dashboard can read. It is worth being precise about what Semarize is not, because it shapes the build: it is not a meeting recorder, not a transcription engine, not a call storage platform, and not a rep-facing review UI. The dashboard you are building is yours, and Semarize feeds it data rather than being the dashboard. That boundary is the reason an afternoon is enough.
Setting up the data layer
Between the API and the dashboard you need somewhere to hold the scored fields, and the choice is mostly about volume. For most teams Airtable is enough: each call is a record in a calls table, each Brick is a column, and the rep and deal context from your CRM attaches as a linked record or lookup. The dashboard reads the base through Airtable's API. For higher call volumes or heavier aggregation, write the fields into Supabase or a similar hosted database instead, where the dashboard can run grouped queries across large windows and join call data to other rep performance sources directly.
Whichever store you pick, model the table the same way: one row per call, the metadata fields (run identifier, Kit version, rep, call date, call type, account or deal reference) as their own columns, then one column per Brick for the typed value and one adjacent column for its evidence quote. Keeping the value and its quote side by side is what lets a single row answer both “did this call pass” and “on what evidence” without a join. Name the Brick columns after the field names in the scored JSON so the write step is a direct key-to-column map with no translation layer, and add the Kit version as a column so a schema change is visible in the data rather than hidden in the pipeline. With that shape in place, every downstream view in the next section is a query over the same flat table.
The write step runs immediately after each Run completes. The webhook fires, an automation reads the typed JSON, and each field lands in the matching column, including the evidence quote as a text field beside its score. You can wire this with code or with a no-code automation; the Make integration handles the webhook-to-table mapping without a server. Either way the dashboard always reflects the most recent scored calls, because there is no manual import between the score and the view.
Building the call QA dashboard: the four views
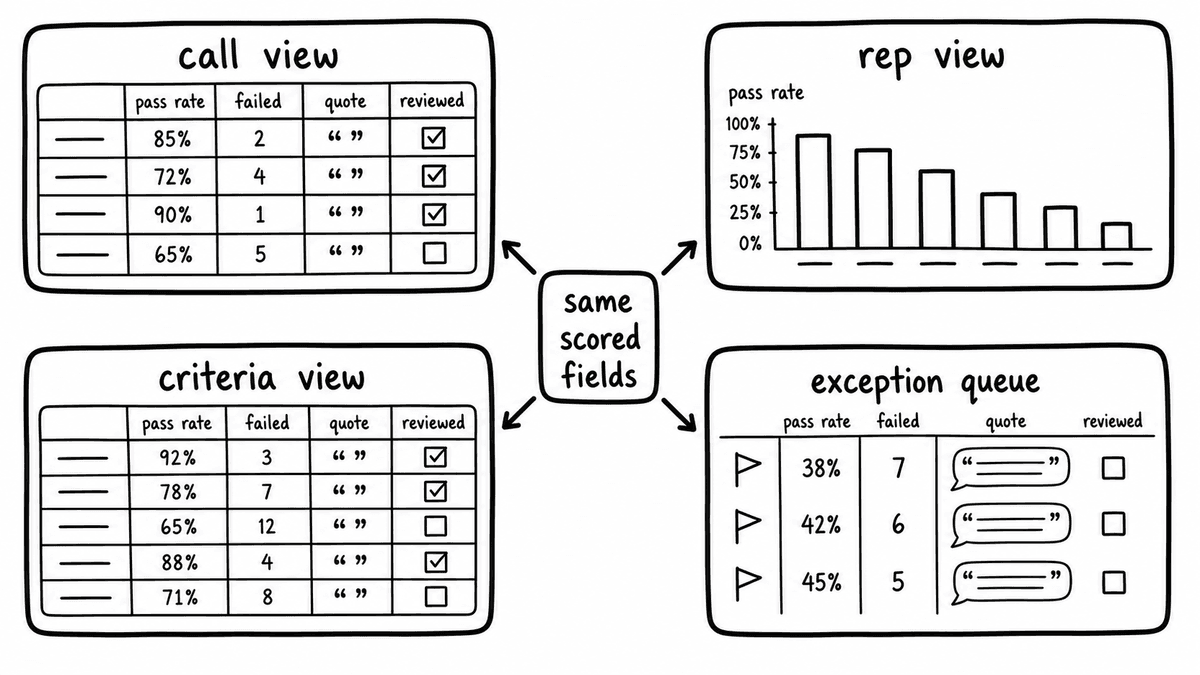
A working call QA dashboard needs four views, and each one reads the same scored fields through a different lens. The call-level view is a table of recent calls with one column per Brick, a pass, fail, or score indicator in each cell, and the metadata columns for rep, date, call type, and account. A reviewer uses it to open a single call and see every criterion at once. The rep-level view aggregates those same fields per rep over a chosen window, showing pass rate on each Brick, so a QA lead can see in a weekly review which reps have a systematic gap rather than an occasional miss.
The criteria-level view inverts the aggregation: for each Brick it shows the percentage of calls in the period that passed, broken down by rep or call type. A criterion only half the team passes is a coaching or scripting problem, and it reads differently from one criterion that a single rep consistently fails. The fourth view is the exception queue, and it is the one reviewers actually live in: a filtered list of calls that tripped a failed-check flag, sorted by date or by failure count, with the evidence quote shown inline beside each flagged call. Filters across all four views run on the metadata fields, and the failed-check flags come straight from reading the boolean Bricks as false.
None of this requires bespoke engineering. Describe the schema and these four views to a vibe-coding tool, give it the field names and the filter behaviour for each view, and name the one action each view supports, and it will produce a working interface you can iterate on in the same session. The data structure is fixed and typed, so the generated UI has a stable contract to build against, and follow-up prompts can refine the aggregation logic or the column order without touching the pipeline underneath.
Making the dashboard auditable and actionable
The dashboard earns its place when it becomes the entry point to the reviewer's day rather than a report they glance at. Set the exception queue as the default landing view, so the reviewer opens the tool and immediately sees the calls that failed the criteria they care about, in priority order. Each flagged call shows its evidence quote beside the score, which means the reviewer can decide whether to act without reopening the recording. That is the difference between a number and an audit: every flag points to the transcript line that justified it, and a rep who disputes a fail can read the exact words the check evaluated.
To close the loop, add one field that records whether a flagged call was reviewed and what the reviewer did, and surface it as a button in the dashboard. Now the exception queue has a state, you have a record of which failures were investigated, and the QA process is a workflow rather than a sampling exercise. The whole thing moves QA from auditing five percent of calls by ear to triaging a hundred percent of failed checks against evidence, which is the same shift covered in our piece on scoring every call without manual review. Because the scored data is typed and versioned, the interface can keep evolving while the QA and compliance pipeline underneath stays exactly where it is.
Semarize turns calls, emails, chats, and transcripts into structured JSON signals, so the scored fields, failed-check flags, and evidence quotes your QA dashboard renders arrive as data your tools can read directly.
Common questions
What data does a call QA dashboard actually read?
It reads the scored JSON returned by a Run of your QA Kit, one object per call. Each object carries a run identifier, the Kit version, and call context for filtering, plus one typed field per Brick: a boolean, a score, an extracted string, or a categorical flag. Where a Brick is configured to return evidence, the field also carries the transcript quote behind the value. The dashboard renders booleans as failed-check flags, scores as column values, and quotes as the audit trail. It does no scoring itself; it is a view layer over data the API already produced.
How do failed-check flags and evidence quotes appear in the dashboard?
A failed-check flag is just a boolean Brick read as false, so the dashboard filters the calls table for those fields and lists the results in the exception queue. The evidence quote travels in the same scored object, returned by the Brick where the criterion is designed to surface it: a quoted excerpt from the transcript, plus a document reference for grounded checks. Store it as a text field beside the score, and the exception view shows the flag, the criterion it tested, and the exact words that produced it, without the reviewer opening the recording.
Do I need to replace Gong or Chorus to build this?
No. Semarize is supplemental to recording and search platforms, not a replacement. Gong and Chorus keep recording, storing, and surfacing calls; Semarize adds the structured-output layer they do not expose natively. You send the transcript they already hold, or one from Zoom, Teams, Meet, Fathom, or an upload, to a Run of your QA Kit, and the API returns typed JSON. The dashboard reads that JSON. Nothing in your existing call stack changes shape, and you keep your recording platform exactly as it is.
Can one dashboard support multiple Kits with different criteria?
Yes, with a little schema design. Each Kit returns its own set of typed fields, so if a discovery Kit and a QA Kit both run against the same calls, the calls table holds columns for both, and the dashboard filters by Kit to show the relevant criteria per view. Reviewers switch between the discovery scoring view and the QA scoring view with a filter on the same call record, without separate dashboards. Because Kits are versioned, a criterion change is explicit rather than silent, so a Kit update will not quietly break the columns your dashboard reads.
Why use a structured API instead of scoring inside the dashboard?
Because scoring and rendering are different jobs, and coupling them makes both fragile. Semarize returns the same shaped JSON on every Run, with typed fields and versioned schemas, so the dashboard has a stable contract to build against and can be rebuilt or replaced without touching the scoring logic. Putting evaluation inside the dashboard ties your QA criteria to one interface and one prompt, and you lose the audit trail. Keeping the intelligence layer in the API means the same scored fields can feed reporting, CRM enrichment, and automation, not only this one dashboard.
Continue reading
Read more from Semarize
100% QA Scoring Without Manual Review: Deterministic Rubrics for Every Call
Manual QA sampling at 2–5% has two problems: coverage and consistency. Automated scoring with deterministic rubrics solves both - every call gets scored the same way, with no reviewer required to generate the result. The shift isn't just efficiency - it changes what coaching is built from and turns compliance verification from sampling into complete coverage.
Automated Sales Call Scoring
Most automated call scoring measures whether reps followed a script. Script compliance is not the same as buyer understanding, and the scorecard that improves while win rates stagnate is the clearest sign the rubric is measuring the wrong thing.